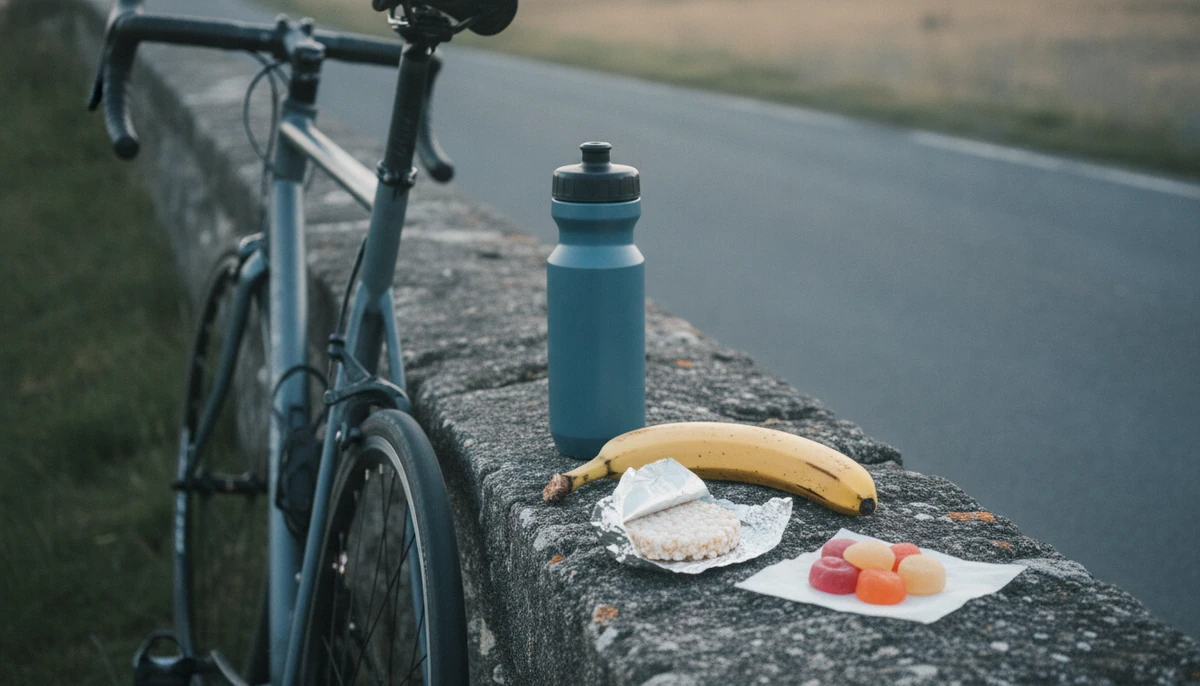
Carbohydrate taken in during a long effort helps you go faster or further, and the longer the effort, the more it helps. Under an hour the gain is small. What it keeps going is mainly your blood sugar and your liver. The carbohydrate stored in your muscles is spared only a little on a long ride. How many grams an hour depends on whom you ask: four sources give four different ladders. Above about 90 grams an hour, nobody has yet shown a faster time.
- Duration decides. Across published time trials the average gain was 2.6% under an hour and 6.2% over two hours.
- It spares the liver more than the muscle. Seven cyclists lasted an hour longer with carbohydrate, while the carbohydrate stored in their muscles fell just as fast.
- The ladders differ. For one to two hours, sources give 30 grams or 30 to 60 grams an hour. For longer efforts: up to 90, 40 to 110, or a proposed 90 to 120.
- More is not automatically faster. The largest dose study found its best result somewhere around 68 to 88 grams an hour.
- The mix matters more than the form. Glucose alone stalls near 60 grams an hour; drink, gel or chew made little difference.
Somewhere in the second or third hour of a long ride or run, the question comes up: should I eat, and how much? The numbers you hear range from a gel an hour to 120 grams. This piece looks at what the research measured, and where the advice comes from.
One thing first. This is about carbohydrate taken in during the effort. What you eat the days before and the hours after is a subject of its own.
1 Does carbohydrate on the move help at all?
Yes, and more so the longer you go. A 2014 review lined up the time-trial studies it found that compared carbohydrate with a placebo drink.1 In trials under an hour the average gain was 2.6%. From one to two hours it was 4.9%, and over two hours 6.2%. Of the 20 studies lasting over two hours, 19 found a clear benefit (figure 2).

The spread around each average is wide, so a single number tells you little about one race. What holds across the studies is the direction: the longer the effort, the more there is to gain. A 2017 position stand passes on a more cautious reading from two earlier reviews. When riders have eaten beforehand, they see a consistent benefit only from about 90 minutes. The same stand notes that lab studies so often test riders after a night without food.2
2 What actually runs out?
You start with two stores of carbohydrate, both in the form of glycogen. Your muscles hold about 400 to 500 grams, your liver about 100.34 The liver's share keeps your blood sugar up, and it is the smaller of the two. After a night without food, a scanner study measured about 50 grams in trained cyclists (figure 3).5

A review puts numbers on how fast the liver empties. At about 70% of maximal oxygen uptake, the most oxygen your body can use, a 75-kilogram athlete uses about 30 grams of it an hour. Starting from a full liver of about 100 grams, and without carbohydrate, low blood sugar sets in by about three hours.6 The muscle store we come back to in a moment. What you take in is the third source, and it arrives by the hour.
3 So what does eating on the move keep topped up?
Mainly your blood sugar and your liver, much less your muscles. A classic 1986 study had seven trained cyclists ride at about 71% of their maximum until they could not go on. They did it once with flavoured water and once with a carbohydrate drink every 20 minutes.7 With water they stopped after 3.0 hours, with carbohydrate after 4.0. Their muscle glycogen fell at the same rate in both (figure 4). The extra hour ran on carbohydrate from the drink.

One caveat: the water ride always came first. The researchers checked that by having five riders do the water ride twice, and those two rides differed by 7 minutes on average.
A 2015 study measured both stores with a scanner, in 14 trained cyclists riding three hours at a moderate effort with 102 grams of sugar an hour.8 Their liver glycogen held steady; their muscle glycogen fell, from 101 to 60 and from 114 to 67 in the units of the scanner (figure 5). In four of them, who also rode with water only, the liver fell as well.

For the muscle, the pooled studies disagree a little. A 2018 analysis of 181 studies found no meaningful sparing.9 A newer analysis of 31 placebo-controlled studies found a small but statistically significant sparing effect, as a 2026 review describes it.6 That review adds that sparing is seen more often in running than in cycling.
Short, hard efforts may differ. In 48 minutes of hard intervals, nine cyclists used about 40% less muscle glycogen with carbohydrate. Their liver use was also 40% lower, about 5 grams, but that difference was not statistically clear.10 For you that means carbohydrate may spare your muscles somewhat, but on a long steady ride not by much. Mostly, the drink feeds the work directly.
4 How much per hour?
It depends on how long you go, and on which source you follow. The best-known advice comes as a ladder by duration, and four sources draw it differently (figure 6).

The 2016 position stand of the American College of Sports Medicine and two dietetic associations starts with "not needed" under 45 minutes. It gives small amounts for hard efforts of 45 to 75 minutes, 30 to 60 grams an hour from one to two and a half hours, and up to 90 grams beyond that.11 A 2014 review splits the middle: 30 grams for one to two hours, 60 grams for two to three, 90 grams beyond two and a half.12 The 2014 systematic review gives 40 to 110 grams beyond two hours.1 And a 2026 review proposes raising the upper limit from 90 to 120 grams, at least for trained athletes.6
The ladders also assume a certain athlete. The 2014 review says its numbers are for well-trained athletes and may need to come down for others.12 Its own example is a runner who takes five hours over a marathon. At that pace, 90 grams an hour comes close to, or above, all the carbohydrate the body burns. The systematic review says the same for a low absolute effort.1 So for a recreational pace, the upper rungs are not written for you.
5 Is more always faster?
Not as far as anyone has measured. The largest dose study gave 51 recreationally trained men between 0 and 120 grams an hour during two hours of riding, followed by a time trial.13 Each rider did a placebo and three of the doses, at one of four labs, so each dose rests on about a dozen riders. The gain rose with the dose and levelled off. The estimated gain peaked at 78 grams an hour, with the best dose somewhere between about 68 and 88. At 108 and 120 grams the riders did no better (figure 7).

That curve fell just short of the authors' own threshold for significance, so read the peak as a region, not a number. Two 2026 reviews looked at the newer studies. Both find that the research does not show a faster time, or more of your own stores spared, above about 90 grams an hour.1415 The higher intakes do get burned: at 120 grams an hour more of the drink was used than at 90. But the share that got burned dropped, from 86% to 76%, and the mix of sugars changed as well.16 Where performance was timed, more did not help. In skiers, 144 grams an hour gave the same 30-kilometre time as 72.17 In a mountain marathon, 120 grams gave the same race time as 60 or 90.18 All three, with the dose study above, were small.
6 Which carbohydrate?
Glucose on its own runs into a limit in the gut, at about 60 grams an hour. Add fructose and more gets through, because fructose is absorbed by a different route.1912 In trained cyclists, raising glucose from 72 to 108 grams an hour hardly raised what was burned from it: 48 against 50 grams, by our conversion.20 With glucose and fructose together, the highest rate reached 105 grams an hour from an intake of 144 (figure 8).21

In the same study, more riders reported severe stomach complaints with the high dose of glucose alone.20 So the mix matters most once you go above about 60 grams an hour. Below that, one study cited by the systematic review found the body burned a mix no faster than glucose alone.1
For years the standard mix was two parts glucose to one part fructose.22 Newer reviews lean toward something closer to equal, about 0.8 parts fructose to 1 part glucose.22 In one study of 12 cyclists at 90 grams an hour, that ratio gave the most burned from the drink. By our sum it was 66 grams an hour, against 55 for the two-to-one mix (figure 9).23 The shift rests on a handful of small studies, and the 2016 position stand called the research on such mixtures equivocal.11

7 Drink, gel or bar?
The form made little difference to what the body burned. At 108 grams an hour a gel and a drink came out the same.24 At 120 grams a drink, a gel, a chew and a mix of the three were all within a few grams of each other (figure 10).25 A bar came closest to an exception. Over three hours it was not significantly behind a drink, but it fell behind late in the ride and left the stomach feeling fuller.26

These are small laboratory studies of eight or nine men on bikes, and none was built to measure race times. What they show is that the body can use carbohydrate from any of these forms.
8 How often?
Guidelines say every 10 to 15 minutes.2 The few studies that varied the schedule found it mattered little. A gel every 15 minutes or a double one every 30 gave the same total carbohydrate use, the same gut comfort and the same ride to exhaustion afterwards.27 An older study used a small dose, about 21 grams an hour. In it, food every half hour or every hour made no difference to a sprint at the end of four hours, though only the half-hourly schedule beat a placebo.28 In runners, larger sips every 20 minutes even led to more carbohydrate burned than small sips every five.29
The one warning concerns very large portions. In skiers taking 144 grams an hour, two big feeds caused more gut discomfort than six smaller ones.17 This is little research, all of it in small groups, so treat it as a sketch.
9 What do athletes actually take in?
It varies hugely, between races and between people. In 221 athletes across five kinds of race, average intake ran from 35 grams an hour in a marathon to 71 in one Ironman (figure 11).30 Individuals reported anything from 6 to 136 grams. In the Ironman races the average was above the guideline of the time, 30 to 60 grams an hour. It was below the 90 grams the 2016 position stand allows for efforts this long. In the marathon, 73% took in less than that older guideline.

The same study shows the other side. About 31% of the Ironman athletes reported serious stomach or gut symptoms, and those who took in more carbohydrate reported more nausea. In both Ironman races, athletes who took in more also finished faster, a link that does not show cause.30 A review names gut symptoms as a possible reason many athletes stay below the guidelines.6
10 Does it help you recover for the next day?
It may, but only two small studies have tested it. In one, seven cyclists rode to exhaustion on water, and at least a week later did the same work with carbohydrate. The next day they rode a time trial: 41:49 after carbohydrate, 42:50 after water, a small difference.31 The water ride always came first, and their muscle glycogen was not measured.
One field trial randomised 26 elite trail runners to 60, 90 or 120 grams an hour during a mountain marathon. All of them had trained their gut to take in more.18 A day later the 120-gram group showed fewer signs of muscle damage and did better on jump and running tests. Their race times did not differ, and only 20 runners were analysed, six or seven per group.15 The reviews call the recovery argument promising but uncertain.1514
11 So what does this leave you with?
Four answers, one for each question you started with.
- Does it help? Yes, and more the longer you go. Under an hour the gain is small; over two hours it is consistent.
- What does it do? It keeps your blood sugar and liver going and feeds the work directly. It spares your muscle store only a little on a long ride, more in running and perhaps in hard intervals.
- How much? Sources give ladders from 30 to 90 grams an hour by duration, written for trained athletes. Above about 90 grams, nobody has measured a faster time.
- Which kind, and how? The gut takes up glucose alone to about 60 grams an hour; mixes with fructose let more through. Drink, gel and chew were burned alike, and the one warning in the studies is very large portions at once.
Carbohydrate on the move does not keep your muscles full. It keeps you going when the small stores you started with run low.
How we did this (for the curious)
We first mapped how the topic is defined in 14 position stands and reviews, then read the studies behind each figure. Every number on this page is in a source we hold. Where we converted grams per minute to grams per hour, or added two numbers, we say so. We read all 31 sources here in full; two of them as the authors' accepted manuscript.
Sources
31 sources, all research or guidelines (T1). We hold and read every one of them in full; two as the authors' accepted manuscript, as noted. After each entry: what we took from it.
- T1 Stellingwerff T, Cox GR. Systematic review: carbohydrate supplementation on exercise performance or capacity of varying durations. Applied Physiology, Nutrition, and Metabolism. 2014;39(9):998–1011. doi:10.1139/apnm-2014-0027. The gain in time-trial performance against a placebo by duration (2.6, 4.9 and 6.2% for under 1, 1 to 2 and over 2 hours), that 19 of 20 studies over 2 hours found a significant benefit, and its intake table (up to 30, 30 to 60 and 40 to 110 grams an hour), to be scaled back when the absolute intensity is low.
- T1 Kerksick CM, Arent S, Schoenfeld BJ, et al. International Society of Sports Nutrition position stand: nutrient timing. Journal of the International Society of Sports Nutrition. 2017;14:33. doi:10.1186/s12970-017-0189-4. Its advice to drink carbohydrate every 10 to 15 minutes, and that a consistent benefit appears only from about 90 minutes when exercise starts in a fed state, as opposed to the fasted state so often studied.
- T1 Hearris MA, Hammond KM, Fell JM, Morton JP. Regulation of muscle glycogen metabolism during exercise: implications for endurance performance and training adaptations. Nutrients. 2018;10(3):298. doi:10.3390/nu10030298. Carbohydrate stored as glycogen in the liver (about 100 grams) and in muscle (about 400 grams), with about 5 grams in the blood as glucose.
- T1 Jensen J, Rustad PI, Kolnes AJ, Lai YC. The role of skeletal muscle glycogen breakdown for regulation of insulin sensitivity by exercise. Frontiers in Physiology. 2011;2:112. doi:10.3389/fphys.2011.00112. Glycogen stores of about 500 grams in muscle and about 100 grams in the liver.
- T1 Fuchs CJ, Veeraiah P, Hermans WJH, et al. Carbohydrate intake of 10 g/kg body mass rapidly replenishes liver, but not muscle glycogen contents, during 12 h of post-exercise recovery in well-trained cyclists. The Journal of Physiology. 2025. doi:10.1113/JP289115. Liver glycogen of 53 and 51 grams on two test days, measured with a scanner in 12 well-trained male cyclists after a night without food.
- T1 Morton JP, Fell JM, Gonzalez JT, Hearris MA, Podlogar T, Pugh JN, Wallis GA. From metabolism to medals: contemporary perspectives and revisiting carbohydrate guidelines for fueling endurance athletes during exercise. The Journal of Nutrition. 2026;156:101442. doi:10.1016/j.tjnut.2026.101442. That a 75-kilogram athlete at about 70% of peak oxygen uptake uses about 30 grams of liver glycogen an hour, that without carbohydrate low blood sugar sets in by about 3 hours, and that the liver holds about 100 grams; its proposal of 90 to 120 grams an hour as the upper limit for most athletes, in its section on cycling; that a meta-analysis of 31 placebo-controlled studies found a small but significant sparing of muscle glycogen, and that sparing is seen more often in running than in cycling; that more than 80% of the research was done on recreational to trained participants and fewer than 3% of studies on women alone; and that five of its seven authors report ties with a sports-nutrition company. Its proposal, in the abstract and its guideline section, is for at least trained athletes.
- T1 Coyle EF, Coggan AR, Hemmert MK, Ivy JL. Muscle glycogen utilization during prolonged strenuous exercise when fed carbohydrate. Journal of Applied Physiology. 1986;61(1):165–172. doi:10.1152/jappl.1986.61.1.165. Seven trained male cyclists at about 71% of maximal oxygen uptake: fatigue after 3.02 hours with flavoured water and 4.02 hours with carbohydrate every 20 minutes; muscle glycogen over time in both (its Figure 1C); that the pattern of muscle glycogen use did not differ over the first 3 hours; that the extra hour relied little on muscle glycogen; and that the placebo trial came first by design.
- T1 Gonzalez JT, Fuchs CJ, Smith FE, et al. Ingestion of glucose or sucrose prevents liver but not muscle glycogen depletion during prolonged endurance-type exercise in trained cyclists. American Journal of Physiology. Endocrinology and Metabolism. 2015;309(12):E1032–E1039. doi:10.1152/ajpendo.00376.2015. Fourteen trained cyclists for 3 hours at 50% of peak power with 102 grams an hour of glucose or sucrose, and four of them with water as a reference: liver and muscle glycogen before and after, measured with a scanner.
- T1 Areta JL, Hopkins WG. Skeletal muscle glycogen content at rest and during endurance exercise in humans: a meta-analysis. Sports Medicine. 2018;48(9):2091–2102. doi:10.1007/s40279-018-0941-1. From 181 studies: that carbohydrate taken during exercise had no effect on sparing muscle glycogen, and that running used moderately less muscle glycogen than cycling.
- T1 Hannon SC, Henthorn L, Vadher J, et al. Application of 13C MRS demonstrates carbohydrate feeding spares muscle but not liver glycogen utilization during high-intensity interval exercise. American Journal of Physiology. Endocrinology and Metabolism. 2026;331(3):E320–E334. doi:10.1152/ajpendo.00139.2026. Nine trained male cyclists, eight 5-minute maximal intervals with 60 grams of carbohydrate an hour or a placebo: muscle glycogen use about 40% lower with carbohydrate (not when caffeine and other ingredients were added); liver glycogen use 40% lower, about 5 grams, but not significantly different. Two authors report ties with a sports-nutrition company.
- T1 Thomas DT, Erdman KA, Burke LM. American College of Sports Medicine joint position statement. Nutrition and athletic performance. Medicine & Science in Sports & Exercise. 2016;48(3):543–568. doi:10.1249/MSS.0000000000000852. Its Table 2 of intake during exercise by duration (not needed under 45 minutes, small amounts at 45 to 75 for hard efforts, 30 to 60 grams an hour at 1 to 2.5 hours, up to 90 grams beyond 2.5 to 3 hours), that forms from liquid to solid may be useful, and that its evidence panel found the evidence for glucose and fructose mixtures equivocal.
- T1 Jeukendrup A. A step towards personalized sports nutrition: carbohydrate intake during exercise. Sports Medicine. 2014;44(Suppl 1):S25–S33. doi:10.1007/s40279-014-0148-z. Its ladder by duration (its Figure 1); that the guidelines are for well-trained athletes and may need to be adjusted downwards for others; its example of the runner who takes five hours over a marathon; that intake can be a drink, a gel or a bar; that the glucose transporter saturates at around 60 grams an hour; that the intake was for many years capped at 60 grams; and that in running there are signs of less muscle glycogen use. The author was at the Gatorade Sports Science Institute, and the paper appeared in its supplement.
- T1 Smith JW, Pascoe DD, Passe DH, et al. Curvilinear dose-response relationship of carbohydrate (0–120 g·h−1) and performance. Medicine & Science in Sports & Exercise. 2013;45(2):336–341. doi:10.1249/MSS.0b013e31827205d1. Fifty-one recreationally trained male cyclists and triathletes at four laboratories, 2 hours of steady riding with 0 to 120 grams an hour followed by a time trial: the estimated gains of 1.0 to 4.7% from 9 to 78 grams an hour, the measured 4.0 and 3.3% at 108 and 120 grams, the uncertainty of the optimum (about 68 to 88 grams), and that the curve fell just short of the authors' own threshold for significance. The first author worked at the Gatorade Sports Science Institute.
- T1 Plews DJ, Booth PD, Krieger T, Maunder E. Fuelled or fooled? Examining the evidence and mechanisms behind ultra-high carbohydrate intake in endurance athletes. Sports Medicine. 2026;56:2367–2388. doi:10.1007/s40279-026-02462-z. That clear evidence for more performance beyond about 30 to 90 grams an hour is lacking, that promoting very high intakes to amateur athletes is premature, and that one author heads research at a micronutrition company with no present commercial interest in carbohydrate fuelling products.
- T1 Wilson PB. A narrative review of the high-carbohydrate fueling revolution (≥ 100 g/h) in the professional peloton. Sports Medicine. 2026;56:295–313. doi:10.1007/s40279-025-02372-6. That the few studies comparing 100 grams an hour or more with 60 to 90 grams show no clear evidence of spared stores or better performance, that a benefit for recovery over several days is possible but small studies make it uncertain, with six or seven runners per group in the mountain-marathon trial; and that the author reports no competing interests.
- T1 Podlogar T, Bokal Š, Cirnski S, Wallis GA. Increased exogenous but unaltered endogenous carbohydrate oxidation with combined fructose-maltodextrin ingested at 120 g h−1 versus 90 g h−1 at different ratios. European Journal of Applied Physiology. 2022;122(11):2393–2401. doi:10.1007/s00421-022-05019-w. Eleven men cycling for 3 hours: more carbohydrate burned from the drink at 120 than at 90 grams an hour (1.51 against 1.29 grams a minute in the last hour), the body's own carbohydrate use unchanged, and no difference in stomach comfort; the share of the intake that was burned fell from 86% to 76%. Dose and ratio differed at the same time (2 parts glucose to 1 of fructose at 90 grams, 1 to 0.8 at 120), and performance was not measured.
- T1 Stocks B, Betts JA, McGawley K. Effects of carbohydrate dose and frequency on metabolism, gastrointestinal discomfort, and cross-country skiing performance. Scandinavian Journal of Medicine & Science in Sports. 2016;26(9):1100–1108. doi:10.1111/sms.12544. Accepted manuscript read. Thirteen skiers: no difference in performance time between 144 and 72 grams an hour, and more gut discomfort when 144 grams an hour came in two large feeds.
- T1 Viribay A, Arribalzaga S, Mielgo-Ayuso J, et al. Effects of 120 g/h of carbohydrates intake during a mountain marathon on exercise-induced muscle damage in elite runners. Nutrients. 2020;12(5):1367. doi:10.3390/nu12051367. And the companion paper on the same race: Urdampilleta A, Arribalzaga S, Viribay A, et al. Nutrients. 2020;12(7):2094. doi:10.3390/nu12072094. Twenty-six elite trail runners who had trained their gut, randomised to 60, 90 or 120 grams an hour, 20 analysed: lower muscle-damage markers and better jump and run tests 24 hours later with 120 grams, and no difference in race time.
- T1 Burke LM, Hawley JA, Wong SH, Jeukendrup AE. Carbohydrates for training and competition. Journal of Sports Sciences. 2011;29(Suppl 1):S17–S27. doi:10.1080/02640414.2011.585473. That absorption of glucose in the gut is limited to about 1 gram a minute and that a carbohydrate absorbed another way, such as fructose, lets more through.
- T1 Jentjens RL, Moseley L, Waring RH, Harding LK, Jeukendrup AE. Oxidation of combined ingestion of glucose and fructose during exercise. Journal of Applied Physiology. 2004;96(4):1277–1284. doi:10.1152/japplphysiol.00974.2003. Eight trained cyclists for 2 hours: peak rates of 0.80 and 0.83 grams a minute burned from 1.2 and 1.8 grams of glucose a minute, and 1.26 from 1.2 grams of glucose plus 0.6 of fructose; and that more riders reported severe stomach complaints with the high dose of glucose alone.
- T1 Jentjens RL, Jeukendrup AE. High rates of exogenous carbohydrate oxidation from a mixture of glucose and fructose ingested during prolonged cycling exercise. British Journal of Nutrition. 2005;93(4):485–492. doi:10.1079/bjn20041368. Eight trained male cyclists for 150 minutes: peak rates of 1.06 grams a minute from 1.2 of glucose, and 1.75 from 1.2 of glucose plus 1.2 of fructose.
- T1 Podlogar T, Wallis GA. New horizons in carbohydrate research and application for endurance athletes. Sports Medicine. 2022;52(Suppl 1):5–23. doi:10.1007/s40279-022-01757-1. That the 2 to 1 ratio of glucose to fructose became the standard recommendation, and that a ratio closer to 1 to 0.8 appears better for the share burned and for gut comfort at high intakes. Published in a supplement supported by the Gatorade Sports Science Institute.
- T1 O'Brien WJ, Stannard SR, Clarke JA, Rowlands DS. Fructose-maltodextrin ratio governs exogenous and other CHO oxidation and performance. Medicine & Science in Sports & Exercise. 2013;45(9):1814–1824. doi:10.1249/MSS.0b013e31828e12d4. Twelve male cyclists, 2 hours at 90 grams an hour with three ratios of fructose to glucose: the grams of each burned from the drink, and the highest total at a ratio of 0.8 to 1.
- T1 Pfeiffer B, Stellingwerff T, Zaltas E, Jeukendrup AE. CHO oxidation from a CHO gel compared with a drink during exercise. Medicine & Science in Sports & Exercise. 2010;42(11):2038–2045. doi:10.1249/MSS.0b013e3181e0efe6. Eight trained male cyclists at 108 grams an hour: peak rates of 1.44 grams a minute from a gel and 1.42 from a drink, not significantly different.
- T1 Hearris MA, Pugh JN, Langan-Evans C, et al. 13C-glucose-fructose labeling reveals comparable exogenous CHO oxidation during exercise when consuming 120 g/h in fluid, gel, jelly chew, or coingestion. Journal of Applied Physiology. 2022;132(6):1394–1406. doi:10.1152/japplphysiol.00091.2022. Accepted manuscript read. Nine trained men at 120 grams an hour: rates of 1.56 (drink), 1.58 (gel), 1.59 (chew) and 1.66 grams a minute (a mix of the three), not significantly different. The products came from a sports-nutrition company with which one author was affiliated.
- T1 Pfeiffer B, Stellingwerff T, Zaltas E, Jeukendrup AE. Oxidation of solid versus liquid CHO sources during exercise. Medicine & Science in Sports & Exercise. 2010;42(11):2030–2037. doi:10.1249/MSS.0b013e3181e0efc9. Eight trained cyclists, 3 hours at 93 grams an hour: peak rates of 1.25 grams a minute from a bar and 1.34 from a drink, not significantly different, with the bar 15% lower at 120, 135 and 150 minutes, and a fuller stomach with the bar.
- T1 Jones RO, Vaz De Oliveria M, Palmer B, et al. Different carbohydrate ingestion patterns do not affect physiological responses, whole-body substrate oxidation or gastrointestinal comfort in cycling. European Journal of Sport Science. 2025;25(7):e12336. doi:10.1002/ejsc.12336. Twenty recreationally active men, 3 hours at lactate threshold with 90 grams an hour as gels: 22.5 grams every 15 minutes or 45 grams every 30 minutes made no difference to the carbohydrate burned or to the test that followed.
- T1 Fielding RA, Costill DL, Fink WJ, King DS, Hargreaves M, Kovaleski JE. Effect of carbohydrate feeding frequencies and dosage on muscle glycogen use during exercise. Medicine & Science in Sports & Exercise. 1985;17(4):472–476. doi:10.1249/00005768-198508000-00012. Nine men, 4 hours of cycling with the same amount of carbohydrate every 30 or every 60 minutes: no difference in the final sprint between the two schedules.
- T1 Mears SA, Boxer B, Sheldon D, et al. Sports drink intake pattern affects exogenous carbohydrate oxidation during running. Medicine & Science in Sports & Exercise. 2020;52(9):1976–1982. doi:10.1249/MSS.0000000000002334. Twelve well-trained male runners: the same drink as 200 millilitres every 20 minutes gave 23% more carbohydrate burned from it than 50 millilitres every 5 minutes, with no difference in stomach comfort.
- T1 Pfeiffer B, Stellingwerff T, Hodgson AB, et al. Nutritional intake and gastrointestinal problems during competitive endurance events. Medicine & Science in Sports & Exercise. 2012;44(2):344–351. doi:10.1249/MSS.0b013e31822dc809. Two hundred and twenty-one athletes in five kinds of race: average intake per hour by race, individual intakes from 6 to 136 grams an hour, serious gut symptoms in about 31% of the Ironman athletes, more nausea with higher intake and, in the Ironman races, faster finishing times with higher intake; and that 73% of the marathon runners took in less than the ACSM guideline of the time (30 to 60 grams an hour, 2009). Professional riders in stage races, also in the study, are not in our figure.
- T1 Clauss M, Skattebo Ø, Rasen Dæhli M, et al. Carbohydrate ingestion during prolonged cycling improves next-day time trial performance and alters amino acid concentrations. Medicine & Science in Sports & Exercise. 2023;55(12):2228–2240. doi:10.1249/MSS.0000000000003264. Seven trained male cyclists rode to exhaustion on water and at least a week later did the same work with carbohydrate: a next-day time trial of 41:49 against 42:50 after water, a small effect; the water trial always came first, and muscle glycogen was not measured.
Found a mistake here? Tell us at info@enduranceproof.com. You do not need to be a scientist, and "this number looks off" is a perfectly good message. Anything we correct, and when, goes on our corrections page.
This is educational material about carbohydrate taken in during exercise. It is not training, nutrition or medical advice, and not a recommendation for or against any method, product or diet.